Direction Study the following line graph and answer the questions. Exports from Three Companies Over the Years (in Pesetas) Line Charts Questions and Answers
1.

For which of the following pairs of years the total exports from the three Companies together are equal?

A. 1995 and 1998
B. 1996 and 1998
C. 1997 and 1998
D. 1995 and 1996
Answer:D
Explanation:

Total exports of the three Companies X, Y and Z together, during various years are:

In 1993 = (30 + 80 + 60) = 170

In 1994 = (60 + 40 + 90) = 190

In 1995 = (40 + 60 + 120) = 220

In 1996 = (70 + 60 + 90) = 220

In 1997 = (100 + 80 + 60) = 240

In 1998 = (50 + 100 + 80) = 230

In 1999 = (120 + 140 + 100) = 360

Clearly, the total exports of the three Companies X, Y and Z together are same during the years 1995 and 1996.


2.

Average annual exports during the given period for Company Y is approximately what percent of the average annual exports for Company Z?


A. 87.12%
B. 89.64%
C. 91.21%
D. 93.33%
Answer: D

Explanation:

Analysis of the graph: From the graph it is clear that

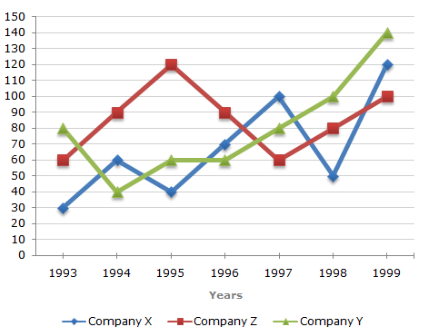
1. The amount of exports of Company X (in Pesetas) in the years 1993, 1994, 1995, 1996, 1997, 1998 and 1999 are 30, 60, 40, 70, 100, 50 and 120 respectively.

2. The amount of exports of Company Y (in Pesetas.) in the years 1993, 1994, 1995, 1996, 1997, 1998 and 1999 are 80, 40, 60, 60, 80, 100 and 140 respectively.

3. The amount of exports of Company Z (in Pesetas) in the years 1993, 1994, 1995, 1996, 1997, 1998 and 1999 are 60, 90,, 120, 90, 60, 80 and 100 respectively.

Average annual exports (in Pesetas) of Company Y during the given period

= 1/7 x (80 + 40 + 60 + 60 + 80 + 100 + 140) = 560/7= 80.

Average annual exports (in Pesetas) of Company Z during the given period

= 1/7 x (60 + 90 + 120 + 90 + 60 + 80 + 100) = (600/7 ) .

Therefore Required percentage =

Line Charts Questions and Answers


3.

In which year was the difference between the exports from Companies X and Y the minimum?


A. 1994
B. 1995
C. 1996
D. 1997
Answer: C

Explanation:

The difference between the exports from the Companies X and Y during the various years are:

In 1993 = (80 - 30) = 50

In 1994 = (60 - 40) = 20

In 1995 = (60 - 40) = 20

In 1996 = (70 - 60) = 10

In 1997 = (100 - 80) = 20

In 1998 = (100 - 50) = 50

In 1999 = (140 - 120) = 20

Clearly, the difference is minimum in the year 1996.


4.

What was the difference between the average exports of the three Companies in 1993 and the average exports in 1998?


A. 15.33
B. 18.67
C. 20
D. 22.17
Answer: C

Explanation:

Average exports of the three Companies X, Y and Z in 1993

= [ 1/3 x (30 + 80 + 60) ] = ( 170/3)

Average exports of the three Companies X, Y and Z in 1998

= [1/3 x (50 + 100 + 80) ] = (230/3)

Difference [ ( 230/3) - ( 170/3) ]

= ( 60/3) = 20


5.

In how many of the given years, were the exports from Company Z more than the average annual exports over the given years?


A. 2
B. 3
C. 4
D. 5
Answer: C

Explanation:

Average annual exports of Company Z during the given period

= 1/7 x (60 + 90 + 120 + 90 + 60 + 80 + 100)

= ( 600/7) = 85.71

From the analysis of graph the exports of Company Z are more than the average annual exports of Company Z (i.e., 85.71) during the years 1994, 1995, 1996 and 1999, i.e., during 4 of the given years.